Page 1 of 2
DCCHART Sample
Posted: Tue Jul 14, 2015 8:37 pm
by Andy Edward
Hi Roger,
In DCCHART sample (/exp19/samples/RMCHART/DCCHART.exe) I've noticed that when I hover on the charts to make the tooltip show, the memory consumption goes up quite a bit.
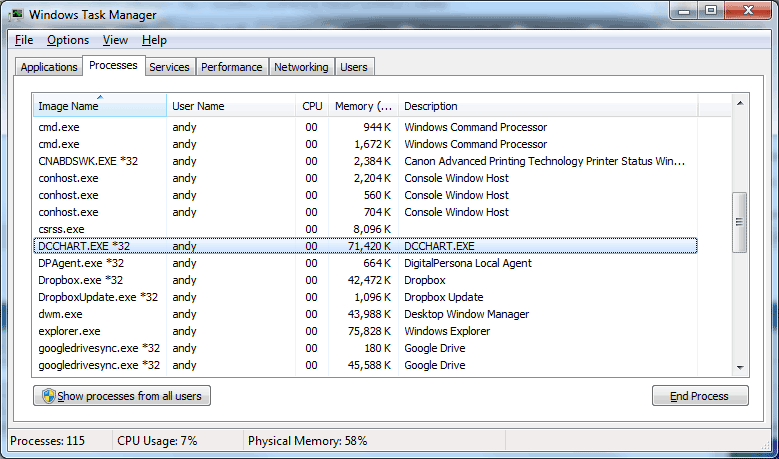
Here is the task manager screenshot after moving left and right between the two bar graphs for about 1 minute or 2. The memory usage rise to 71MB from 16MB when I started the sample.

- Untitled-1.gif (37.7 KiB) Viewed 25025 times
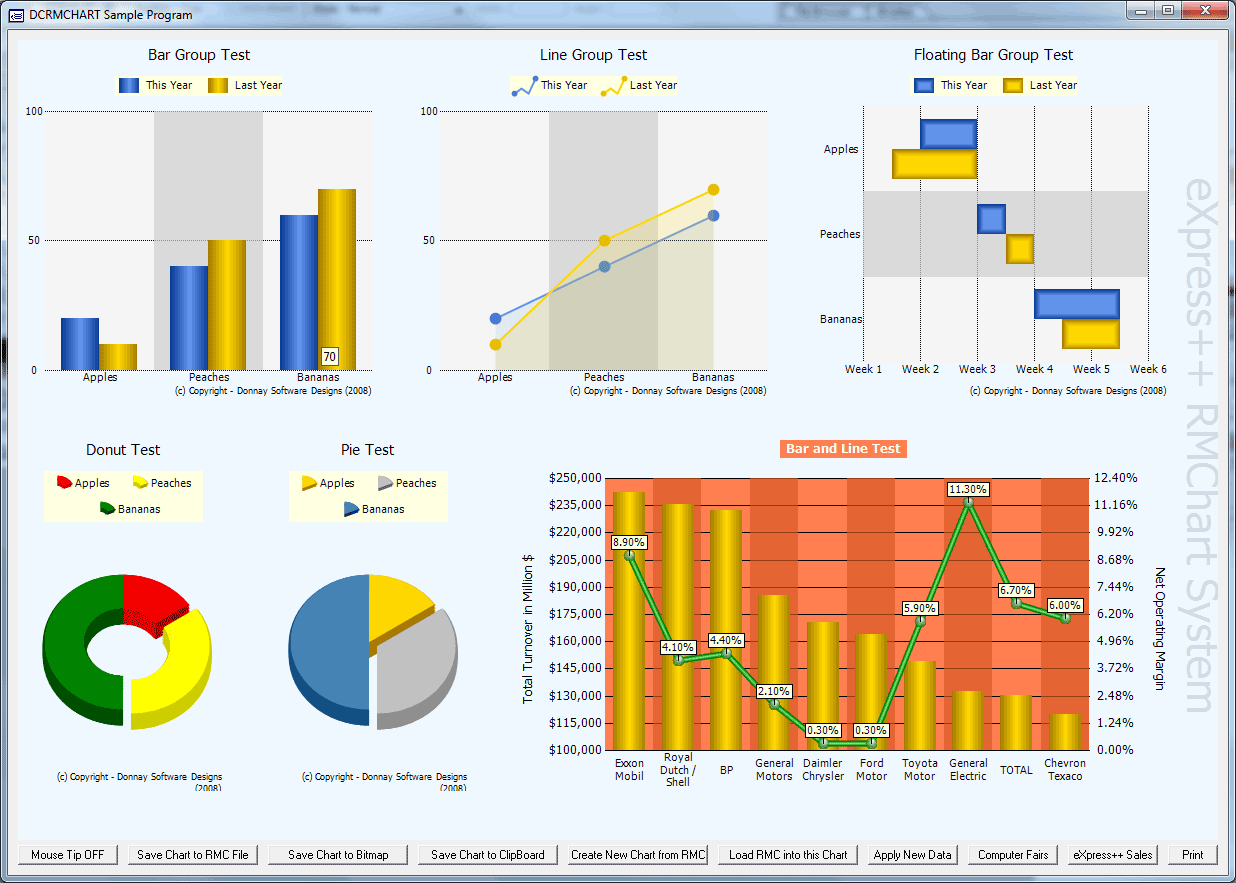
I was only moving the mouse between the blue and gold bar graph under bananas x-axis

- Untitled-2.gif (81.57 KiB) Viewed 25025 times
Perhaps it's because the show tooltip always create new objects and never destoy them?
Regards,
Andy
Re: DCCHART Sample
Posted: Wed Jul 15, 2015 6:35 am
by rdonnay
Perhaps it's because the show tooltip always create new objects and never destoy them?
This may be true. I would have to look at the code.
Which tooltips are you referring to?
Are these the tooltips that are written in eXpress/Xbase++ code.
Re: DCCHART Sample
Posted: Wed Jul 15, 2015 7:15 am
by rdonnay
I looked at the code to determine if there were a possibility of creating objects that are not destroyed when using tooltips.
I wrote this code to make sure that this did not happen.
Look at _DCRMCHT.PRG (line 287). This creates the tooltip window only 1 time.
When the mouse is moved, only the data in the window is rewritten and the window is moved.
I see nothing that would cause it to not reclaim resources.
Can you provide evidence that moving the mouse causes memory to increase?
Re: DCCHART Sample
Posted: Wed Jul 15, 2015 7:36 am
by Tom
I noticed a similar problem with DC/RMChart, but not related to tooltips. If I create about 40, 50 charts in a row, a runtime error comes up ("automation error" or something like this - I don't remember exactly), and no charts are generated anymore. I assume there is a memory problem inside RMChart. To prevent a runtime error, the charts are encapsulated in sequences now. If an error occurs, a blank window with a message is shown. I tried almost everything, but I didn't find a solution yet. Since there is no RMChart support anymore, the only solution would be to use a different tool. Maybe this is related to what Andy sees.
Maybe I can create a sample.
Re: DCCHART Sample
Posted: Wed Jul 15, 2015 10:34 am
by rdonnay
I have heard of no reports of problems like this with my customer who has a lot of RMchart regions on his application.
It would be good to have more information.
Re: DCCHART Sample
Posted: Wed Jul 15, 2015 7:33 pm
by Andy Edward
rdonnay wrote:Can you provide evidence that moving the mouse causes memory to increase?
Just to clarify, it's not the movement of the mouse that cause the memory to increase, but it's when I hover on the graph to show the tooltip.
This is what I can do to provide evidence
http://screencast.com/t/z8tZCCk6. It will need the newest Adobe Flash Player installed in your browser
Please take note how the DCChart*32's memory usage increases ever so slightly whenever I hover between the two bar graphs.
Regards,
Andy
Re: DCCHART Sample
Posted: Thu Jul 16, 2015 7:52 am
by rdonnay
Andy -
I ran the sample and I can confirm that memory usage increases when the tooltip is displayed.
I also determined that it has nothing to do with the actual display of the tooltip or any problem with Rmchart.
It is caused by the following code in _dcrmcht.prg:
Code: Select all
#if XPPVER > 1900345
nSeconds := Seconds()
aPos := GetPointerPos()
IF Empty(::toolTipWindow) .OR. !::toolTipWindow:isVisible()
  DO WHILE Seconds() - nSeconds < .3
    aPos1 := GetPointerPos()
    IF aPos1[1] # aPos[1] .OR. aPos1[2] # aPos[2]
      RETURN nil
    ENDIF
    Sleep(10)  <<<<<< Add this line of code at line 273
  ENDDO
ENDIF
#endif
This code is there to give a delay before showing the tooltip to prevent flicker.
I left out a very important thing. I am always very aware of the importance of putting a sleep() in a DO loop like this, but I missed it.
Without the Sleep() it will run through the loop thousands of times per second.
Add the line of code and rebuild dclipx.dll by running build19_sl1.bat or build20.bat.
Re: DCCHART Sample
Posted: Sun Jul 19, 2015 7:27 pm
by Andy Edward
Hi Roger,
Thank you for the reply, unfortunately it has not stop the memory increase.
As the code change is in METHOD DC_XbpRMChart:ShowToolTip( nMouseButton, nX, nY, aData ), this method is only called when we click the button on the bottom left.
Code: Select all
@ 805,0 DCPUSHBUTTON CAPTION {||'Mouse Tip ' + IIF(oRMChart:toolTipEnable,'OFF','ON')} ;
    SIZE 100,20 ACTION {||oRMChart:toolTipEnable := !oRMChart:toolTipEnable, ;
                          DC_GetRefresh(GetList), ;
                          oRMChart:showToolTip(-1)}
but if we immediately try to hover the graphs after the charts appear (without clicking on the button), the memory increase still occurs.
Perhaps I can have your _dcrmcht.prg to test out in my system?
Regards,
Andy
Re: DCCHART Sample
Posted: Mon Jul 20, 2015 7:02 am
by rdonnay
Here is the source file with changes.
Re: DCCHART Sample
Posted: Mon Jul 20, 2015 10:54 pm
by Andy Edward
HI Roger,
When I was trying to test your sample the first time I removed/comment the mouseMove action like so:
Code: Select all
DCREAD GUI ;
    SETAPPWINDOW ;
    FIT ;
    TITLE 'DCRMCHART Sample Program' ;
    OPTIONS GetOptions ;
    EVAL {||oRMChart:RMCToolTipWidth := 100, ;
            oRMChart:RMCUserWatermark := 'eXpress++ RMChart System', ;
            oRMChart:RMCUserWMAlignment := RMC_TEXTRIGHT, ;
            oRMChart:RMCUserWMFontSize := 32, ;
            oRMChart:RMCUserWMLucent := 40, ;
            oRmChart:mouseDown := ;
            {|a,b,c,d,e,o|aData := e,nWhich := a,o:=Thread():new(),o:start({||BrowseCallbackData(nWhich,aData,oRMChart)})}, ;
            ;//oRmChart:mouseMove := ;                                                              <===== COMMENTED OUT
            ;//{|nMouseButton,b,nX,nY,aData|oRMChart:showToolTip( nMouseButton, nX, nY, aData )}, ; <===== COMMENTED OUT
            oRmChart:draw(), ;
            ShowDebugInfo(oRMChart), (wtf adata), ;
            (wtf oRMChart:regions)}
Now I realize that showToolTip method is not just when we click the button on the bottom left, but also when the mouse moves..sorry about that.
After I remove the comments, it gives me an error when the mouse moves. So I'm unable to test whether the memory issue still happening or not, until I can settle the error below.
------------------------------------------------------------------------------
ERROR LOG of "C:\exp19260\Samples\Rmchart\DCCHART.EXE" Date: 07/21/2015 12:14:15
Xbase++ version : Xbase++ (R) Version 1.90.331
Operating system : Windows 06.01 Build 07601 Service Pack 1
------------------------------------------------------------------------------
oError:args :
-> VALTYPE: U VALUE: NIL
-> VALTYPE: N VALUE: 5
oError:canDefault : N
oError:canRetry : N
oError:canSubstitute: Y
oError:cargo : NIL
oError:description : Parameter has a wrong data type
oError:filename :
oError:genCode : 2
oError:operation : <U of >[<5>]
oError:osCode : 0
oError:severity : 2
oError:subCode : 3
oError:subSystem : BASE
oError:thread : 1
oError:tries : 0
------------------------------------------------------------------------------
CALLSTACK:
------------------------------------------------------------------------------
Called from DC_XBPRMCHART:SHOWTOOLTIP(253)
Called from (B)MAIN(221)
Called from ACTIVEXOBJECT:COMDEFAULTHANDLER(668)
Called from XBPACTIVEXCONTROL:COMDEFAULTHANDLER(2991)
Called from XBPACTIVEXCONTROL:COMEVENTDISPATCHER(2972)
Called from (B)ACTIVEXOBJECT:REGISTEREVENTHANDLER(402)
Called from XBPBROWSE:FORCESTABLE(1151)
Called from DC_XBPBROWSE:FORCESTABLE(1427)
Called from DC_DEBUGBROWSE(579)
Called from (B)MAIN(221)
Called from DC_GETLIST:READGUI(3781)
Called from DC_READGUI(111)
Called from MAIN(221)
I know the reason is because aData is nil. But I don't know how to debug this aData variable.
Regards,
Andy